Tuesday, April 9, 2013

Friday, April 5, 2013
Fermentation lab Important information
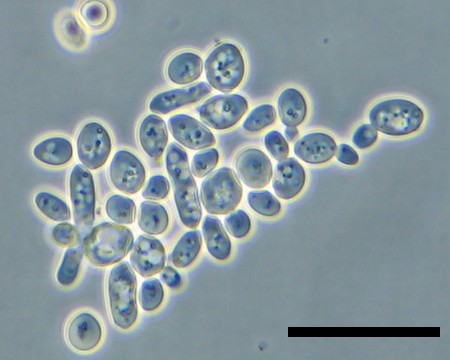
(look on the right hand side of the picture 2/3rds of the way up)
5 and 6. The bottle with the yeast had an strong odor of alcohol.
7. You can use the data from questions 5 and 6 as well as the lab data to answer this question.
8. Read the statement in the question
9. The bottle with the yeast showed a yellow result
10. Use the answers from questions 8 and 9 to complete this question.
Monday, April 1, 2013

Friday, February 8, 2013
Osmosis Lab
- Blot dry tubing and mass
- Post data
- Clean up cups
- Graph data (use and average all data)
- Answer:
- What is shown by the results?
- Explain what happened. Include the appropriate terms and diagrams
- Using the data provided here graph the results.
- Using the graph created determine what the concentration of the unknown solution.
Data Collection Form
Results
Monday, December 10, 2012
carbon footprint
Calculate your carbon footprint
Calculator
Upon calculating your footprint choose 1 area that you assessed and develop a plan to reduce your carbon emissions.
Calculate the following
1. How much would you reduce your footprint by making this change?
2. How much would this change cost you as a consumer.
Calculator
Upon calculating your footprint choose 1 area that you assessed and develop a plan to reduce your carbon emissions.
Calculate the following
1. How much would you reduce your footprint by making this change?
2. How much would this change cost you as a consumer.
Monday, November 12, 2012
Population Unit Assessment
Assessment Tuesday Nov 13th
Work to be turned
Work to be turned
- 19-1 notes
- 19-2 notes
- 19-3 notes
- Population packet
- Human population growth lab
- Estimating populations lab (skittle lab)
- Predator prey populations lab
- Review Sheets
Wednesday, September 19, 2012
Period 1 Postlab Assignment
1. Within your group produce a graph that shows the relationship
between playing video games and reaction time. (every student must have a
completed graph)
2. Compare your groups graph to the class data
3. Write a brief discussion ( steps 1 and 2 ) that answers the question. "Does playing video games improve reaction time?"
2. Compare your groups graph to the class data
3. Write a brief discussion ( steps 1 and 2 ) that answers the question. "Does playing video games improve reaction time?"
Subscribe to:
Posts (Atom)