Wednesday, September 18, 2013

Monday, June 3, 2013
Biotech poster
1. Define what the technology does (how it works, why is it important)
2. Diagram how the technology works (key terms and equipment must be labeled)
2. Diagram how the technology works (key terms and equipment must be labeled)
- Drawing required
- Step by step description required
- Medicine
- Food production
- Criminal investigation
- Any other field which relates to our daily lives
Tuesday, May 14, 2013
Meiosis review questions
1.
Explain how meiosis differs from mitosis.
2.
Why meiosis is called reduction division? What
is being reduced? What is being divided?
3.
A) What is synapsis? B) Draw a tetrad. C) Draw a
crossing over using different colors. D) during what stage synapsis occur?
4.
Why from an evolutionary perspective synapsis
make sense?
5.
Explain the advantage of meiosis during sexual
reproduction over mitosis during asexual reproduction from an evolutionary perspective.
6.
Why is important that sex cells are haploid?
Explain why the accuracy of meiosis play a major role in the survival of a
child and give an example of what happens when there is a mistake in meiosis?
Use a human life cycle as an example.
7.
Diagram and label what is happening at each
stage of meiosis. Use 4 homologue pairs.
Tuesday, April 9, 2013
Friday, April 5, 2013
Fermentation lab Important information
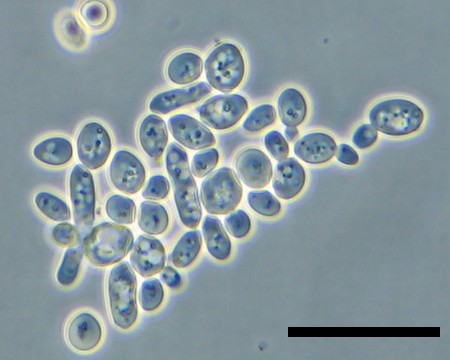
(look on the right hand side of the picture 2/3rds of the way up)
5 and 6. The bottle with the yeast had an strong odor of alcohol.
7. You can use the data from questions 5 and 6 as well as the lab data to answer this question.
8. Read the statement in the question
9. The bottle with the yeast showed a yellow result
10. Use the answers from questions 8 and 9 to complete this question.
Monday, April 1, 2013

Friday, February 8, 2013
Osmosis Lab
- Blot dry tubing and mass
- Post data
- Clean up cups
- Graph data (use and average all data)
- Answer:
- What is shown by the results?
- Explain what happened. Include the appropriate terms and diagrams
- Using the data provided here graph the results.
- Using the graph created determine what the concentration of the unknown solution.
Data Collection Form
Results
Subscribe to:
Posts (Atom)