Tuesday, December 10, 2013
Sunday, December 8, 2013
Tuesday, December 3, 2013
Skin Deep Human evolution and skin color
It's all about Vitamins
1. Why did humans evolve dark skin pigmentation?
2. What are the risks associated with being folate depleted?
3. How does the risk of being folate depleted relate to the process of natural selection for human skin color?
4.Why don't other primates living near the equator (gorillas, chimpanzees) have dark skin pigmentation?
5. Why did humans evolve low (think light skin) skin pigmentation?
6. What are the risks of being Vitamin D deficient?
7. How does being Vitamin D deficient relate to the process of natural selection for human skin color?
7. At what latitude can humans no longer produce enough Vitamin D regardless of skin color?
8. How come humans can now live above this Vitamin D latitudes regardless of skin color?
Wednesday, November 27, 2013
Tuesday, November 26, 2013
Monday, November 18, 2013
Monday, November 11, 2013
Monday, November 4, 2013
Thursday, October 24, 2013
Predator Prey Lab Analysis Questions
Discussion Section: Round 1 (Deer Only)
1. Did the class data fully support your hypothesis regarding the effect of having no predators on the deer population? Did it disprove your hypothesis? Did it support your hypothesis but with certain exceptions? (1-2 sentences)
2. What specific data from your lab led you to support or reject your hypothesis? Refer to your graphs as evidence to support your judgment regarding your hypothesis. (1 paragraph)
3. Use your understanding of community ecology to explain why the results did/did not support your hypothesis. If your hypothesis was disproved, how has your understanding of community ecology changed? (1 paragraph)
4. What were the limitations of our model (simulation) for round 1? What impact do these limitations have on the data? (1 paragraph)
Discussion Section: Round 2 (Deer and Wolves)
1. Did the class data fully support your hypothesis regarding the effect of having predators on the deer population and the wolf population? Did it disprove your hypothesis? Did it support your hypothesis but with certain exceptions? (1-2 sentences)
2. What specific data from your lab led you to support or reject your hypothesis? Refer to your graphs as evidence to support your judgment regarding your hypothesis. (1 paragraph)
3. Use your understanding of community ecology to explain why the results did/did not support your hypothesis. If your hypothesis was disproved, how has your understanding of community ecology changed? (1 paragraph)
4. What were the limitations of our model (simulation) for round 2? What impact do these limitations have on the data? (1 paragraph)
Discussion Section: Round 3 (Deer, Wolves, and Hunters)
1. Did the class data fully support your hypothesis regarding the effect of human hunters on the deer population and the wolf population? Did it disprove your hypothesis? Did it support your hypothesis but with certain exceptions? (1-2 sentences)
2. What specific data from your lab led you to support or reject your hypothesis? Refer to your graphs as evidence to support your judgment regarding your hypothesis. (1 paragraph)
3. Use your understanding of community ecology to explain why the results did/did not support your hypothesis. If your hypothesis was disproved, how has your understanding of community ecology changed? (1 paragraph)
4. What were the limitations of our model (simulation) for round 3? What impact do these limitations have on the data? (1 paragraph)
Predator Prey Lab Class Data
Use your class data to graph all three rounds.
1 round per graph
Round 1 Deer only (one line)
Round 2 Deer and Wolves ( two lines) *if you are really thinking you will use 2 vertical axis scales
Round 3 Deer, Wolves and Hunters (two lines) * if you are really thinking you will use 2 vertical axis scales
Period 1 Class Data
Period 3 Class Data
1 round per graph
Round 1 Deer only (one line)
Round 2 Deer and Wolves ( two lines) *if you are really thinking you will use 2 vertical axis scales
Round 3 Deer, Wolves and Hunters (two lines) * if you are really thinking you will use 2 vertical axis scales
Period 1 Class Data
Period 3 Class Data
Thursday, September 26, 2013
Self Reflection and Peer Feedback Form
Upon completion of the peer review of the results section please complete the following form.
Self reflection and Peer Feedback
Self reflection and Peer Feedback
Tuesday, September 24, 2013
Writing the results section
Use lab write to guide the writing of the results section of your lab
Use the remainder of the period to write the results section of your lab. Upon completion ask a member of your lab group to review your results section using this rubric.
Use the remainder of the period to write the results section of your lab. Upon completion ask a member of your lab group to review your results section using this rubric.
Visualizing the data from the video game lab
Upon completion of the testing please do the following
1. Make sure all members of your lab group have entered their data
2.Graph the data collected from your group
3. Graph the class data
If you need help creating the graphs please go to labwrite.
1. Make sure all members of your lab group have entered their data
2.Graph the data collected from your group
3. Graph the class data
If you need help creating the graphs please go to labwrite.
5. Visualizing the data:
Now that you have entered your data in a table or spreadsheet, you are ready to represent your data in the appropriate visual format for your lab report.
- Establish what types of data you have, quantitative or qualitative (refer to the Resources page in the web version of this document; once there, choose "Data Types").
- Determine if the data should be represented as a table or a graph (refer to the Resources page in the web version of this document; once there, choose "Tables vs. Graphs").
- If you decide to use a graph to represent your data, determine which type of graph is one that best represents your data (refer to the Resources page in the web version of this document; once there, choose "Graph Types").
- If a table is the best format for your data, then modify the table you used to collect your data so that it is labeled and organized properly (refer to the Resources page in the web version of this document; once there, choose "Designing Tables").
- If you need help creating a spreadsheet to make a table or graph, refer to the Resources page in the web version of this document. Once there, choose "Excel Tutorial."
- Remember that the purpose of your table or graph is to summarize your findings for yourself and for others and to reveal trends in your data.
Monday, September 23, 2013
Video Game Lab Data Collection Sheet
Data Collection Sheet
Enter data here for your lab group.
All data must be entered
Class Data for your use
Enter data here for your lab group.
All data must be entered
Class Data for your use
Wednesday, September 18, 2013
Monday, June 3, 2013
Biotech poster
1. Define what the technology does (how it works, why is it important)
2. Diagram how the technology works (key terms and equipment must be labeled)
2. Diagram how the technology works (key terms and equipment must be labeled)
- Drawing required
- Step by step description required
- Medicine
- Food production
- Criminal investigation
- Any other field which relates to our daily lives
Tuesday, May 14, 2013
Meiosis review questions
1.
Explain how meiosis differs from mitosis.
2.
Why meiosis is called reduction division? What
is being reduced? What is being divided?
3.
A) What is synapsis? B) Draw a tetrad. C) Draw a
crossing over using different colors. D) during what stage synapsis occur?
4.
Why from an evolutionary perspective synapsis
make sense?
5.
Explain the advantage of meiosis during sexual
reproduction over mitosis during asexual reproduction from an evolutionary perspective.
6.
Why is important that sex cells are haploid?
Explain why the accuracy of meiosis play a major role in the survival of a
child and give an example of what happens when there is a mistake in meiosis?
Use a human life cycle as an example.
7.
Diagram and label what is happening at each
stage of meiosis. Use 4 homologue pairs.
Tuesday, April 9, 2013
Friday, April 5, 2013
Fermentation lab Important information
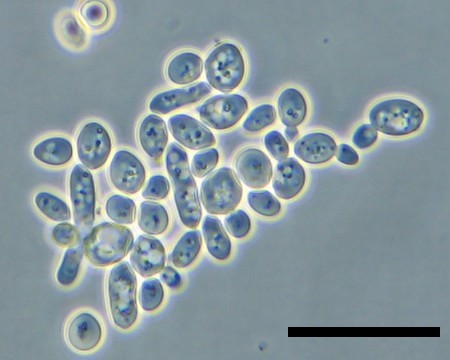
(look on the right hand side of the picture 2/3rds of the way up)
5 and 6. The bottle with the yeast had an strong odor of alcohol.
7. You can use the data from questions 5 and 6 as well as the lab data to answer this question.
8. Read the statement in the question
9. The bottle with the yeast showed a yellow result
10. Use the answers from questions 8 and 9 to complete this question.
Monday, April 1, 2013

Friday, February 8, 2013
Osmosis Lab
- Blot dry tubing and mass
- Post data
- Clean up cups
- Graph data (use and average all data)
- Answer:
- What is shown by the results?
- Explain what happened. Include the appropriate terms and diagrams
- Using the data provided here graph the results.
- Using the graph created determine what the concentration of the unknown solution.
Data Collection Form
Results
Subscribe to:
Comments (Atom)